 17 min read
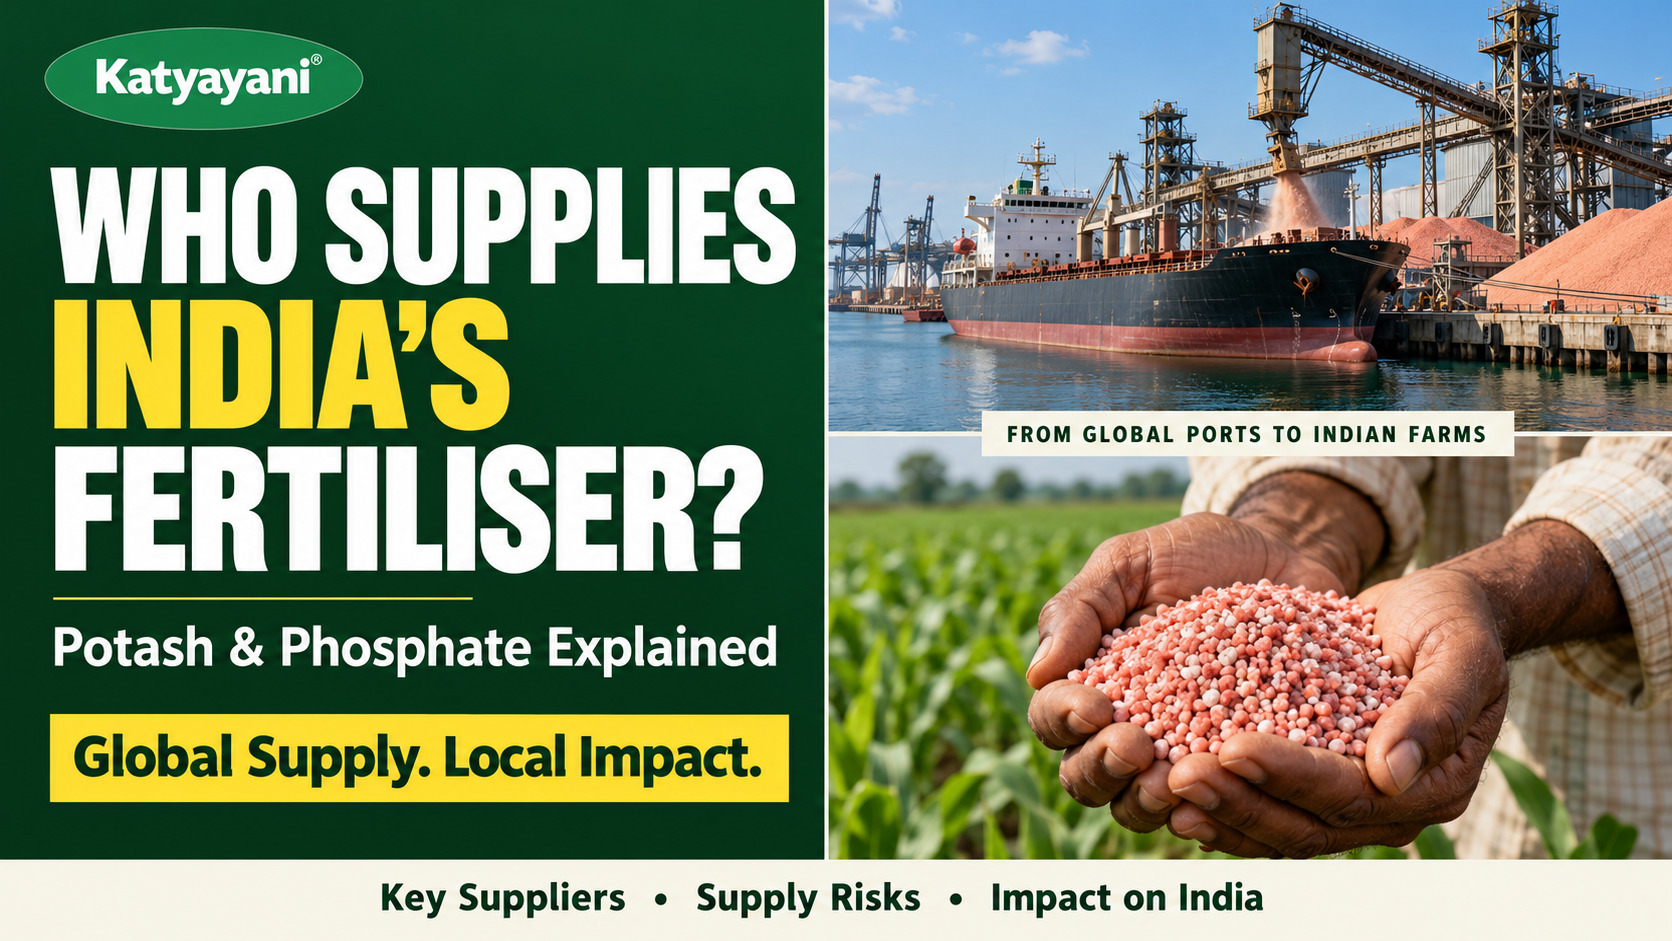
Canada is the biggest potash producing country: about 15 million tonnes of K2O in 2025 (USGS estimate), roughly 30% of the world total. Russia is second and China and Belarus follow. Canada, Russia and Belarus together made 70.5% of 2024 output by NRCan's count. For phosphate rock, China leads (about 110 million tonnes), but Morocco holds about two thirds of the world's reserves. India has no commercial potash production and imports nearly all of it. Phosphates are the tight market in 2026; potash is not.
Which are the top potash producing countries in the world?
Canada, Russia, China, Belarus and Germany make up the top five in 2025, based on the USGS Mineral Commodity Summaries 2026. The table below shows the USGS numbers in thousand tonnes of K2O equivalent. "e" means an estimate. The 2025 column is an estimate, not a final count.
| Rank (2025e) | Country | 2024 output | 2025e output | Share of 2025e (my calculation) |
|---|---|---|---|---|
| 1 | Canada | 14,400 | 15,000 | 30.6% |
| 2 | Russia | 10,000 (e) | 10,000 | 20.4% |
| 3 | China | 6,300 (e) | 6,300 | 12.9% |
| 4 | Belarus | 5,000 (e) | 6,000 | 12.2% |
| 5 | Germany | 2,500 (e) | 3,000 | 6.1% |
| 6 | Laos | 2,400 (e) | 2,400 | 4.9% |
| 7 | Israel | 2,260 | 2,000 | 4.1% |
| 8 | Jordan | 1,730 | 1,800 | 3.7% |
| 9 | Chile | 564 | 600 | 1.2% |
| 10 | United States | 410 | 500 | 1.0% |
| Spain, Brazil, other | 1,170 | 1,100 | 2.2% | |
| World total (rounded) | 46,700 | 49,000 | 100% |
USGS notes that it revised the 2024 figures for Belarus, Germany and Laos using company and industry reports. China's output is an estimate. Israel and Jordan take potash from the Dead Sea, which USGS says holds nearly 2 billion tonnes of potassium chloride. The United States made only about 0.5 million tonnes and imported about 5.6 million tonnes in 2025, so the biggest economy in the world is itself a potash importer.
Who is the largest potash producer, and how concentrated is the market?
Canada is the largest producer, and three countries make most of the world's potash. NRCan's Potash facts page (modified 29 January 2026, 2024 data marked preliminary) counts product tonnes rather than K2O:
| Country | 2024 output (thousand tonnes) | Share of world output |
|---|---|---|
| Canada | 24,962 | 32.8% |
| Russia | 16,600 | 21.8% |
| Belarus | 12,100 | 15.9% |
| China | 6,508 | 8.6% |
| Israel | 3,707 | 4.9% |
| Other countries | 12,199 | 16.0% |
| World | 76,076 | 100% |
The three leaders add up to 70.5% of 2024 output. On the USGS K2O basis the same three give about 63% (29.4 of 46.7 million tonnes for 2024, my calculation). The gap comes from the unit and from estimates. NRCan's Belarus figure of 12.1 million product tonnes is about 7.3 million tonnes of K2O at a 60% grade (my rough conversion), which is still well above the USGS estimate of 5.0 million. The two agencies do not agree on Belarus, so quote the source and the unit with any share you publish.
Exports are even more concentrated than output. NRCan reports world potash exports of 59.2 million tonnes in 2024. Canada shipped 22.9 million tonnes (38.7%), Russia held 19.6% and Belarus 18.7%. That is 77% from three countries (my calculation). The NRCan page text says Canada has "over 39%" while its own table says 38.7%, so use the table figure.
Which countries have the largest potash reserves?
Russia has the largest potash reserves in the 2026 USGS edition, not Canada. USGS revised the reserves for Russia and China this year, which changed the order from older lists. Reserves are the part of a deposit that can be mined at a profit today. Resources are larger and less certain.
| Country | Reserves (thousand tonnes K2O) | Approx. share of world (my calculation) |
|---|---|---|
| Russia | 2,000,000 | about 34% |
| Canada | 1,100,000 | about 19% |
| Laos | 1,000,000 | about 17% |
| Belarus | 750,000 | about 13% |
| United States | 220,000 | about 4% |
| China | 200,000 | about 3% |
| Germany | 150,000 | about 3% |
| Chile, Spain (each) | 100,000 | about 2% each |
| Israel, Jordan | "Large" (Dead Sea) | not quantified |
| World total | more than 5,900,000 |
The world total is given only as "more than" 5.9 billion tonnes, so the shares are approximate and slightly high. USGS puts world resources at about 250 billion tonnes. At the current rate of mining, Canada's reserves equal about 73 years of its own 2025 output (1,100 divided by 15, my calculation). An older Indian Bureau of Mines review based on USGS 2023 data gave Canada 33% of reserves and Belarus 22%. Those shares were replaced by the new USGS revisions.
Why does Canada have so much potash?
Canada sits on the Prairie Evaporite, a thick salt layer left by an ancient sea that repeatedly dried up. The layer contains potash beds that can be mined, and nearly all of Canada's potash is in Saskatchewan. NRCan says all 10 active Canadian mines are in Saskatchewan and made about 25 million tonnes in 2024.
Geology papers describe the Prairie Evaporite as a Middle Devonian formation, mostly halite (rock salt) with potash and anhydrite beds, laid down in the Elk Point Basin, which stretched from north-western Alberta into the US plains (summary from Manitoba and University of Saskatchewan geology papers; I could not open the full texts, see section F). The sea dried out in cycles, which concentrated the potassium salts, and the beds stayed fairly undisturbed. USGS also says the same basin continues into Montana and North Dakota, but at depths of 1,800 to 3,100 metres, which is too deep to mine at present. Saskatchewan's beds are shallower and have been mined since the last century.
Canada also has a strong export system. NRCan lists the producers as Nutrien, Mosaic, Compass Minerals and K+S Potash Canada. Nutrien's filings describe Canpotex as the export joint venture with access to four marine terminals, serving customers in over 40 countries. Nutrien reported 2025 potash sales of about 14.25 million tonnes and Mosaic reported 8.8 million tonnes of potash production for 2025 (both from search-result summaries of company releases, flagged VERIFY).
Which companies and new mines will change potash supply?
The main change coming is new capacity in Laos and Russia, plus BHP's Jansen mine in Saskatchewan. USGS says world potash capacity was 66.1 million tonnes of K2O in 2025 and is projected to reach 77.4 million tonnes by 2029, with most of the rise being MOP from new mines and expansions in Laos and Russia. New mines in Belarus, Brazil, Canada, Ethiopia, Morocco and Spain are planned after 2029.
| Project or company | Status (source) |
|---|---|
| BHP Jansen Stage 1 (Saskatchewan) | First production "on track for mid-CY2027", 84% complete at 30 June 2026. Cost estimate US$8.4 billion including contingencies (BHP FY2026 report). |
| BHP Jansen Stage 2 | About US$6.9 billion estimate, 16% complete, first production late FY2031. BHP booked a US$2.3 billion impairment in FY2026. |
| Nutrien and Mosaic (Canada) | Largest Canadian producers named by NRCan. Mosaic's 400,000-tonne Esterhazy hydrofloat expansion made first potash in July 2025 (search-result summary; VERIFY). |
| Belaruskali and BPC (Belarus) | State producer and its sales company. Settled the 2026 India contract (see next section). |
| ICL (Israel) | Signed supply deals for China in 2026: 750,000 tonnes plus an option for 330,000 tonnes (ICL filing, 23 Dec 2025, opened via SEC). |
I did not open production or capacity data for Uralkali, K+S, APC (Jordan) or SQM, so I do not rank them here. NRCan's page names K+S as a Canadian producer. For any company ranking, use the latest annual reports.
How do sanctions and annual contracts move the potash market?
Potash prices for the two biggest buyers are set by annual contracts, and those contract prices then guide the spot market. India and China negotiate with the major suppliers, and the result becomes a global reference. The 2026 round gave India a higher price than China:
| Contract | Price (CFR) | Detail (source) |
|---|---|---|
| India 2026 | $383 per tonne | Belarusian Potash Company and Indian Potash Limited, confirmed by BPC on 18 May 2026; 180 days credit; June to December 2026 deliveries; volume about 600,000 to 650,000 tonnes (estimates by Argus and Profercy). IPL had not publicly confirmed at the time. |
| India 2025 | $349 per tonne | Previous contract, signed June 2025 (Argus via Fertilizer Daily). |
| China 2026 | $348 per tonne | Settled November 2025. ICL's filing for its China supply states the same $348, on a CIFFO basis. |
| China 2025 | $346 per tonne | Reported in the same Fertilizer Daily table. |
The Fertilizer Daily report of 20 May 2026 says India paid $35 more than China, against an average gap of about $8 from 2016 to 2025. It puts most of the gap down to timing: China settled six months earlier, before international prices strengthened. Profercy, quoted in the same article, said the price implies heavily negative import margins under India's subsidy and pricing framework. I found no confirmed 2026 Canpotex contract with India, and the article names no other supplier agreement.
Sanctions explain part of why Belarus now matters again. The US special envoy announced on 19 March 2026 that Belaruskali and BPC would be removed from US sanctions, after a release of political prisoners. EU sanctions on Belarusian potash, introduced in 2022, were reported by search results to run until at least February 2027, and Lithuania has said it will not reopen the Klaipeda port route while they last (search-result summaries; VERIFY). Press reports say Russia's share of India's imports has risen, and I found no official table to confirm it.
How much does one ton of potash cost?
The World Bank benchmark for potassium chloride (MOP) was $368 per tonne in September 2026, down from a peak of $405 in May 2026. India's contract price was $383 CFR. The numbers below come from the World Bank series as published by Protein Report:
| Month | Potassium chloride, US$ per tonne |
|---|---|
| Oct 2024 (24-month low) | 278 |
| Sep 2025 | 353 |
| Jan 2026 | 366 |
| Apr 2026 | 401 |
| May 2026 (peak) | 405 |
| Aug 2026 | 387 |
| Sep 2026 (latest) | 368 |
That is 32% above the October 2024 low and 9% below the May peak (my calculation). NRCan gives context: the same series averaged $295 in 2024, and the peak was $1,202 in April 2022, after the Russia and Belarus export shock. For comparison in the same Protein Report table, DAP was $801, urea $408 and TSP $690 per tonne in September 2026. I did not find a confirmed October 2026 spot assessment for potash or DAP, and the World Bank series is a benchmark, not what your supplier will quote. Freight, port charges, bagging and dealer margin come on top. I also did not find a sourced figure for the Indian MRP of MOP, so I do not quote one.
Which countries lead phosphate rock production and reserves?
China produces the most phosphate rock, Morocco comes second, and Morocco holds by far the largest reserves. The USGS Mineral Commodity Summaries 2026 gives thousand tonnes of marketable phosphate rock:
| Country | 2024 output | 2025e output | Share of 2025e (my calculation) | Reserves |
|---|---|---|---|---|
| China (large mines only) | 105,000 | 110,000 | 44% | 3,400,000 |
| Morocco | 35,300 | 36,000 | 14% | 50,000,000 |
| United States | 19,400 | 20,000 | 8% | 1,000,000 |
| Russia | 14,400 | 14,000 | 6% | 2,400,000 |
| Jordan | 11,500 | 12,000 | 5% | 820,000 |
| Saudi Arabia | 10,000 | 10,000 | 4% | 1,000,000 |
| Egypt | 5,300 | 5,500 | 2% | 2,800,000 |
| Brazil | 5,300 | 5,000 | 2% | 1,600,000 |
| Peru | 4,800 | 4,800 | 2% | 210,000 |
| India | 1,700 | 1,500 | 0.6% | 31,000 |
| World total (rounded) | 239,000 | 250,000 | 100% | 73,000,000 |
China, Morocco and the United States together made about 66% of 2025 output (my calculation). Morocco alone holds about 68% of world reserves (50,000 of 73,000 million tonnes, my calculation). India has only 31 million tonnes of reserves, about 0.04% of the world's (my calculation). USGS also says "there are no imminent shortages of phosphate rock" and that world resources exceed 300 billion tonnes. The tightness in phosphate fertiliser is about processing inputs, exports and politics, not about running out of rock. Note that China's figure covers large mines only, and USGS revised the 2024 Morocco figure this year.
Who supplies DAP and MAP, and what has China changed?
Phosphate rock is turned into DAP, MAP and TSP using phosphoric acid, ammonia and sulphur, so the countries that export finished fertiliser are not the same as the biggest rock producers. The IFA May 2026 report says the five countries that export through the Strait of Hormuz (Iran, Qatar, Saudi Arabia, UAE, Bahrain) supply 18% of global MAP and DAP trade, 34% of urea trade, 23% of ammonia trade and 49% of sulphur trade.
Two shocks hit in 2026. First, the Hormuz disruption since late February. The IFA outlook counted 150,000 tonnes of phosphate fertiliser and 400,000 tonnes of sulphur stuck behind the strait at the end of April, and said India is a significant importer of raw materials and finished fertiliser from the region. A 13 October 2026 trade report says fertiliser shipments through the strait were still close to zero in early September despite a ceasefire, sulphur is above $1,000 per tonne, and phosphate output has been cut in Egypt, Brazil and India (Global Agriculture, opened).
Second, China. A Fertilizer Daily report of 29 July 2026 says China began export curbs in mid-March 2026 on DAP, MAP and some NPK grades, extended at least through August 2026. It cites a Reuters analysis that 50% to 80% of China's fertiliser export volume is restricted. IFA notes that China has periodically restricted urea and phosphate exports every year to keep prices low for its own farmers. I could not find what China decided after August, so check current customs and trade news before you plan September to December stock.
For rock and finished phosphate, the question for India is where else to buy. Press reports mention long-term arrangements with Morocco, Saudi Arabia and Russia (search-result summaries; VERIFY), but only Morocco and Russia sit outside the Hormuz route. IFA's scenarios see global phosphorus use at 40 to 50 million tonnes of P2O5 by 2030, with phosphate demand falling more than potash when prices rise, because it is already hard for farmers to afford.
Does India have potash?
India has potash-bearing rock, but none that is commercially mined today, so it imports almost all of its muriate of potash. The Indian Bureau of Mines Yearbook 2022 (advance release, January 2024) states there is no reported potash production and "the entire requirement" of potash for fertiliser is met through imports.
| Indian potash resource (1 April 2020) | Million tonnes |
|---|---|
| Total resources | 23,091 |
| Of which proved reserves | 0 |
| Polyhalite | 16,164 |
| Sylvite | 2,572 |
| Glauconite | 3,149 |
| Unclassified | 1,206 |
| Rajasthan | 20,572 (89%) |
| Madhya Pradesh | 1,244 (5%) |
| Uttar Pradesh | 893 (4%) |
All of this sits in the "remaining resources" category, which means it is not yet proven to be mineable at a profit. Glauconite (green sandstone) holds only 4% to 7% K2O, per the same review. Most of the resource is in Nagaur district, Rajasthan, then Panna in Madhya Pradesh. GSI is exploring the Nagaur-Ganganagar evaporite basin in Punjab; a May 2025 GSI statement reported potash mineralisation at 630 to 770 metres and new drilling in two Fazilka blocks, but gave no tonnage. A July 2026 summary of a PIB release quotes 456.52 million tonnes of potash resources established in Rajasthan and Punjab; I could not open the PIB original, so treat that as unconfirmed.
The government also pushes substitutes. Potassium Derived from Molasses (PDM, at least 14.5% potash) carries a subsidy of Rs 345 per tonne for kharif 2026 under NBS, and ICAR has developed potassium-solubilising microbes that release potassium already in soil (same July 2026 summary). They reduce, but do not replace, MOP imports. I found no verified Dhariwal-type SOP project in India, so I do not claim one.
Where does India buy its potash and phosphates, and what does the government pay?
India buys MOP from Canada, Russia, Belarus, Israel and Jordan, and DAP from a wider group that has changed fast. The latest full country table I could open is the IBM review for 2021-22, when imports of potash fertiliser were 3.02 million tonnes, down from 5.25 million in 2020-21, and the main suppliers were Belarus (33%), Canada (20%), Israel (17%), Jordan (14%) and Lithuania (9%). Press reports put recent annual MOP imports at about 4 million tonnes, and an Argus outlook said Russia and Belarus supplied just over half of India's imports in January to August 2025 and Canada 37% (snippet only; VERIFY). I found no official 2024-25 country-wise MOP table.
DAP numbers come from Rajya Sabha answers. India imported 55.67 lakh tonnes in 2023-24, of which 22.28 lakh tonnes (40.02%) came from China. In April 2024 to February 2025 imports were 44.19 lakh tonnes and China's share fell to 8.47 lakh tonnes (19.1%). Full-year 2024-25 shows two figures: 45.69 lakh tonnes in one Parliament reply report and 49.72 lakh tonnes in an Indian Chemical News piece citing the ministry, so I have not chosen one. A trade headline says 2025-26 imports rose 36% (61.94 lakh tonnes in a search snippet; VERIFY). See our guides on which countries import the most fertiliser and the DAP and urea shortage in India for the stock and price side.
The government pays a fixed subsidy per kilogram of nutrient on P and K fertilisers, and companies set the retail price. The kharif 2026 NBS rates (1 April to 30 September 2026) are below:
| Nutrient | Rabi 2025-26 (Rs per kg) | Kharif 2026 (Rs per kg) |
|---|---|---|
| Nitrogen (N) | 43.02 | 47.32 |
| Phosphate (P) | 47.96 | 52.76 |
| Potash (K) | 2.38 | 2.38 (unchanged) |
| Sulphur (S) | 2.87 | 3.16 |
The Cabinet approved about Rs 41,534 crore for kharif 2026. The potash rate has stayed at Rs 2.38 per kg, while the phosphate rate went up by Rs 4.80. I found no rabi 2026-27 NBS announcement in my search, so check the PIB or Cabinet decision before you quote rabi rates to customers.
MOP, SOP or NPK: which potash should go on which crop?
MOP is the cheapest and most common potash, SOP costs more and has no chloride, and NPK grades give potash with other nutrients. The Indian Bureau of Mines review describes MOP (potassium chloride, 60% to 62% K2O) as commonly used on carbohydrate crops such as wheat, and SOP as a chloride-free premium potash used mainly on high-value crops such as fruits and vegetables.
| Form | What it is | Where it is used | Note |
|---|---|---|---|
| MOP (muriate of potash) | Potassium chloride, about 60% to 62% K2O | Cereals, pulses, sugarcane, most field crops | Gets the price headlines. Chloride can harm chloride-sensitive crops. |
| SOP (sulphate of potash) | Potassium sulphate, chloride-free, also supplies sulphur | Fruits, vegetables, tobacco and other chloride-sensitive crops | Costs more. USGS says more than 60% of US potash output was SOP and SOPM (langbeinite). |
| Potassium nitrate (13-0-45) | Nitrogen plus potassium, water soluble | Drip fertigation at flowering and fruiting | Priced above MOP. |
| NPK complex grades | Nitrogen, phosphorus and potassium in one granule or powder | Balanced feeding, when a soil test shows more than one gap | Potash content varies by grade. |
Do not choose by price alone. The right dose depends on the soil, the crop and the earlier fertiliser history. A soil test tells you whether potassium is the gap, and our guide on how to read a Soil Health Card shows how to read it. Where the soil needs a potassium top-up in cash crops, growers use the water-soluble grades such as the Katyayani NPK 00-00-50 water-soluble potassium sulphate or the 13-00-45 potassium nitrate. Both product pages leave out their target-crop lists, so confirm the label before advising a dose. The full range is in the NPK fertiliser collection. For crop context, see how potash fits in onion farming and in wheat sowing and seed rate guides, and why some buyers consider DAP alternatives when phosphate is short.
What should dealers and bulk buyers watch in 2026-27?
Watch phosphates first, potash second. Phosphate is exposed to the Hormuz route, sulphur prices and China's export policy, and potash is not. This section is my own reading of the sourced facts above, not a forecast.
- Phosphate supply shock: DAP stayed near $801 per tonne in September 2026 (World Bank series) while potash eased. A dealer who needs DAP for rabi should confirm the supplier's actual stock and landed cost in writing, not a headline price.
- Contract-linked potash: Because the India contract was set at $383 and the benchmark has fallen to $368, potash looks less urgent than phosphate. Do not assume this continues, since the benchmark rose from $278 in a year and a half.
- Timing: India settled in May to June (2025 and 2026). China settled in November 2025. Watch both announcements, because they set the tone for the next season.
- Landed cost: CFR means freight is included to the Indian port. Port handling, bagging, transport and credit cost come on top. Ask for ex-godown and delivered quotes, with the batch and licence details.
- Subsidy lag: NBS rates are fixed for six months. If world prices jump mid-season, companies may delay dispatches until the next rate is announced. Keep a buffer of the products your customers cannot do without.
- Alternatives and pack checks: If DAP is short, ask your supplier which other phosphate grades they can supply, and check the label. Our water-soluble fertiliser bulk guide covers pack sizes and checks for large orders.
What is the supply outlook for potash and phosphate to 2030?
Sourced forecasts say potash supply grows steadily, phosphate stays tight in 2026, and prices should ease in 2027 if shipping recovers. These are the only forecasts I used:
| Source | What it says |
|---|---|
| USGS (Feb 2026) | Potash capacity 66.1 million tonnes K2O (2025) to 77.4 million (2029). Phosphate capacity 63.7 million tonnes P2O5 (2025) to 71.7 million (2029). Fertiliser demand: K2O 41.6 million tonnes in 2025, rising to 45.3 million in 2029; P2O5 47.8 million tonnes in 2025, rising to 51.5 million in 2029. |
| IFA (May 2026) | Potash is not directly hit by Hormuz, but demand could suffer if farmers cut spending on all nutrients. Potash demand about 41 million tonnes by 2030 in all three scenarios; phosphate demand 40 to 50 million tonnes P2O5 by 2030. |
| World Bank Commodity Markets Outlook (30 Apr 2026) | Fertiliser price index rose more than 12% in Q1 2026 and is projected to rise more than 30% in 2026. Prices are expected to ease in 2027 as exports recover. The blog does not give potash or DAP forecasts separately. |
My reading: the World Bank's 2026 jump is led by urea and phosphate, not potash. The potash benchmark, at $368, is below its May peak. The main swing factors are the length of the Hormuz disruption, China's export decision for the rest of 2026, whether Jansen starts on time in mid-2027, and how many Belarusian tonnes reach market if the EU keeps its sanctions.
Conclusion
Canada, Russia and Belarus control most of the world's potash, and China, Morocco and the United States control most phosphate rock, with Morocco holding two thirds of the reserves. India has no commercial potash mine and imports almost all of its MOP, so it follows the contract prices set in Beijing and Delhi. In 2026 the sharper risk is phosphate, because of Hormuz and Chinese export curbs, while potash prices have eased from May. Dealers and bulk buyers should ask for written landed-cost quotes, watch the next NBS announcement and the next contract news, and treat any single headline price as a signal, not a quote.
Why trust this guide
Written by Team Katyayani, Editorial Team at Katyayani Organics. Cross-checked against published research and university extension programs.


Leave a Comment