 6 min read
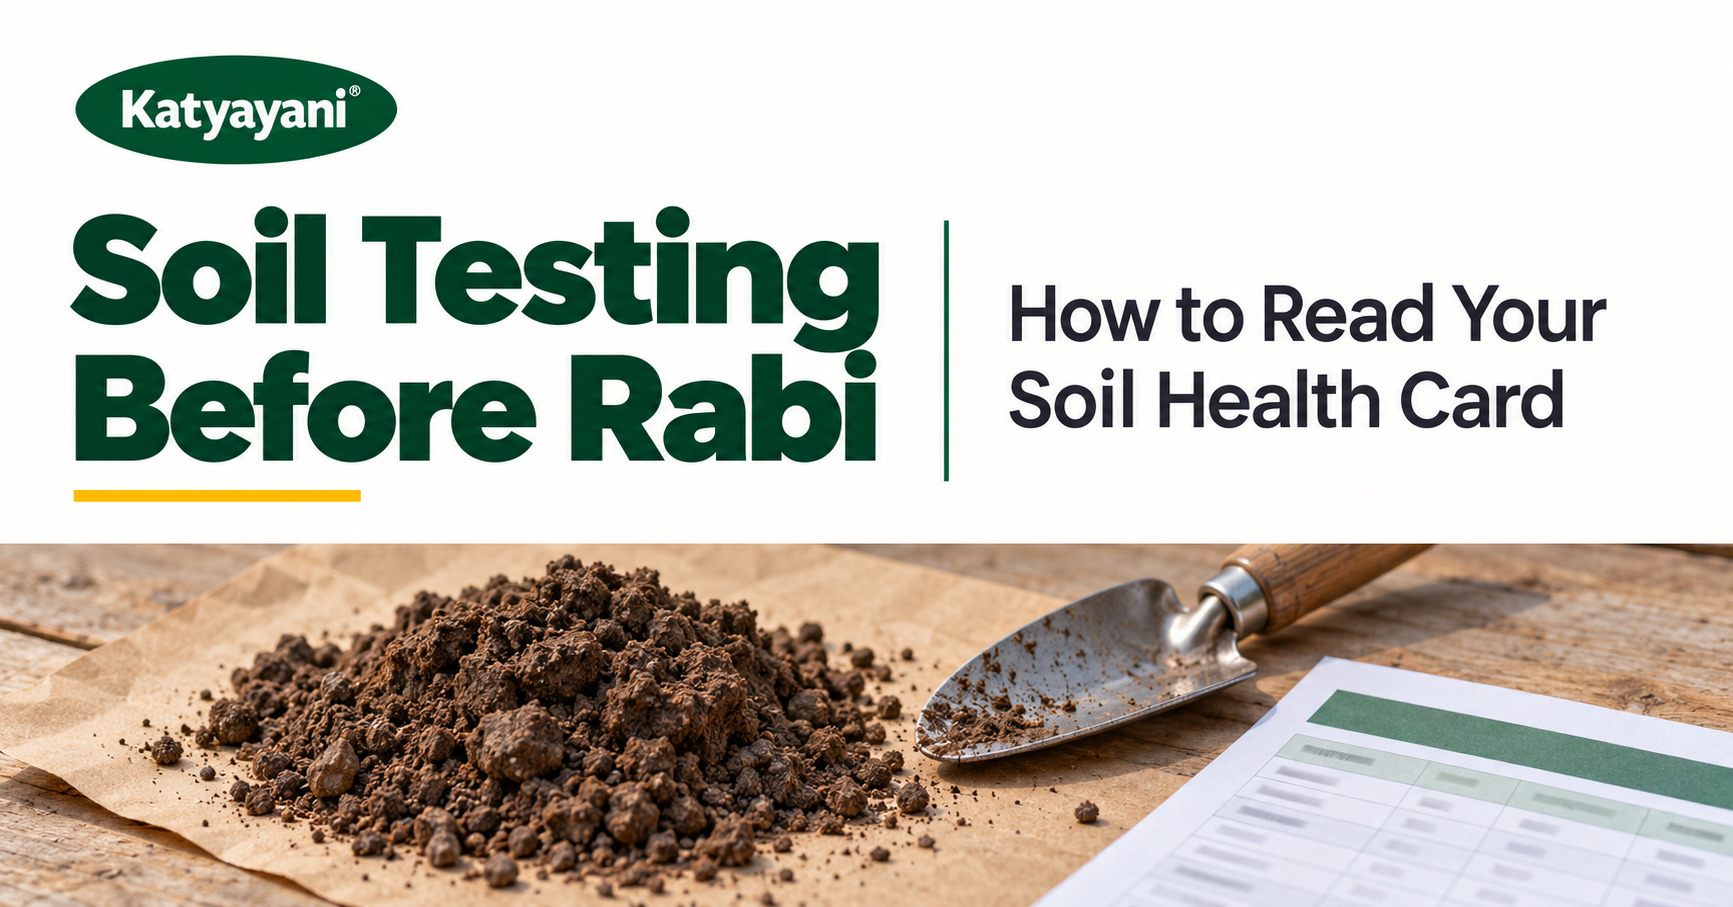
What is a Soil Health Card?
A Soil Health Card (mrida
swasthya card) is a printed or digital report of your field's soil test, issued
under the Government of India's Soil Health Card scheme. It gives the status of
12 soil parameters and a crop-wise fertilizer recommendation for that field.
According to a PIB
factsheet on the Soil Health Card scheme, more than 25 crore cards had been
distributed by July 2025 and cards are issued once every three years. Samples
are drawn on a grid of 2.5 hectares in irrigated areas and 10 hectares in
rainfed areas, and India had 8,272 soil testing labs as of February 2025,
including mini labs and village-level labs.
You can view or download your
card on the Soil Health Card portal
by selecting your state, district and village and entering your name or sample
number. The portal is available in many Indian languages, so you can read it in
Hindi or your regional language.
Why test soil before Rabi sowing?
Testing before Rabi lets you
plan wheat, mustard, chana and potato fertilizer around what your soil actually
lacks. The Rabi basal dose is the largest fertilizer purchase of the year for
many farmers, so this is where a soil test saves the most money.
The ideal time is right after
the Kharif crop is harvested, before you apply any manure or fertilizer for the
next crop. Lab turnaround varies by district and can take a few weeks, so
collect samples in late September or early October to get results before
November sowing.
For dealers and FPOs, soil test
data from a village helps you stock the right mix. If most cards in your area
show low zinc and sulphur, you know zinc sulphate, SSP and gypsum will move
this season.
How to collect a soil sample correctly
A soil test is only as good as
the sample. A wrong sample (from a manure heap or a bund) gives a wrong card
and wrong fertilizer advice.
1.
Walk the field in a zig-zag path and mark 8 to 10
spots. Skip bunds, irrigation channels, tree shade and old manure or compost
pits.
2.
Scrape off surface litter at each spot. Dig a V-shaped
pit 15 cm deep (plough depth) with a spade or khurpi.
3.
Cut a 2 to 3 cm thick slice from one side of the pit,
top to bottom. Collect it in a clean bucket or cloth, not a fertilizer bag.
4.
Mix soil from all spots thoroughly. Spread it, divide
into four parts, discard two opposite parts, and repeat until about 500 g
remains.
5.
Dry the sample in shade, not in direct sun. Pack it in
a clean cloth or polythene bag.
6.
Label it with your name, village, survey or khasra
number, previous crop and the crop you plan to grow. Hand it to the KVK,
agriculture department lab or soil testing camp.
For orchards or deep-rooted
crops, labs may ask for samples from deeper layers as well. Ask your lab before
sampling.
How to read the Soil Health Card, section by section
Every card has three parts:
identification details, test results and recommendations. Read them in that
order.
Part 1: Farmer and sample details
Check your name, village, survey
number, sample number and the date of sampling. If the survey number or field
size is wrong, the recommendation may belong to a different plot. Many cards
also show GPS coordinates of the grid.
Part 2: Soil test results
This table lists each of the 12
parameters with a value, a unit and a rating (low, medium, high, or
deficient/sufficient). Focus on the rating column first. Low or deficient
ratings point to where your money will give the most yield response.
Part 3: Fertilizer recommendations
Most cards give crop-wise doses,
often as two fertilizer combinations (for example, one with DAP and urea,
another with SSP, urea and MOP). Some also list organic manure, micronutrients,
and gypsum or lime where the soil needs correction. Pick the combination that
you can buy locally.
How to read pH, EC and organic carbon
pH, EC and organic carbon (OC)
describe the soil's condition. They decide how much of the applied fertilizer
your crop can actually use.
|
Parameter |
What it
means |
Rating bands |
What to do |
|
pH |
Acidity or alkalinity of
soil |
Below 6.5 acidic; 6.5 to 7.5
normal; above 7.5 alkaline |
Acidic: lime as per lime
requirement. Alkaline or sodic: gypsum as per gypsum requirement test. |
|
EC (dS/m) |
Salt content (salinity) |
Below 1 normal; 1 to 2
critical for sensitive crops; above 2 injurious |
High EC: improve drainage,
avoid saline water, choose tolerant crops and varieties. |
|
Organic carbon (%) |
Organic matter level, soil
life and structure |
Below 0.5 low; 0.5 to 0.75
medium; above 0.75 high |
Low OC: add FYM, compost,
green manure or crop residue instead of burning it. |
Low organic carbon is the most
common problem on Indian cards. Adding well-decomposed FYM or an enriched
vermicompost before sowing improves water holding and nutrient release over
time. Organic carbon also stands in for nitrogen supply, so a low OC card
usually carries a higher nitrogen recommendation.
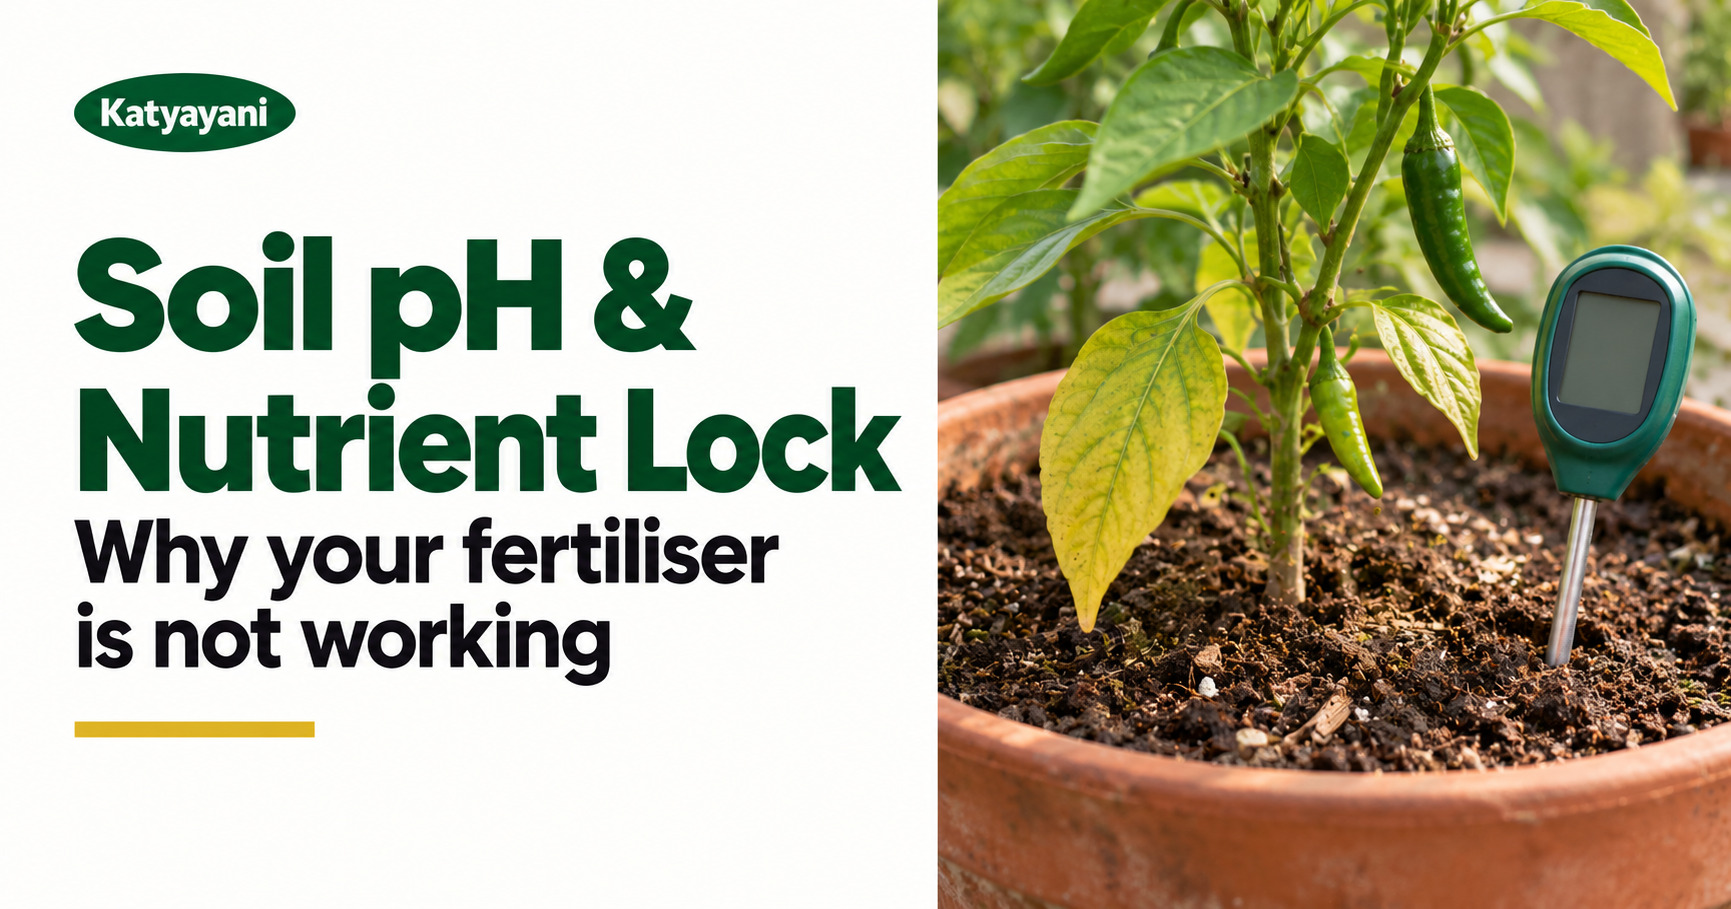
Alkaline soils (pH above 8)
often show low zinc, iron and phosphorus availability even when the soil holds
these nutrients, because they are locked at high pH.
How to read N, P, K and sulphur ratings
N, P, K and S are the
macronutrients on the card, reported as available kg per hectare (S usually in
ppm, which equals mg/kg). The bands below are the ones widely used on Indian
soil test reports.
|
Nutrient |
Low |
Medium |
High |
Unit |
|
Available nitrogen (N) |
Below 280 |
280 to 560 |
Above 560 |
kg/ha |
|
Available phosphorus (P) |
Below 10 |
10 to 25 |
Above 25 |
kg/ha |
|
Available potassium (K) |
Below 108 |
108 to 280 |
Above 280 |
kg/ha |
|
Available sulphur (S) |
Below 10 (deficient) |
|
10 and above (sufficient) |
ppm (mg/kg) |
Check the unit printed on your
card. Some labs report phosphorus as P2O5 and potassium as K2O instead of P and
K. To convert, P × 2.29 = P2O5 and K × 1.2 = K2O. If you are unsure which basis
your lab used, ask them, because the bands change.
Most Indian soils test low to
medium in nitrogen, which is why nitrogen is recommended almost everywhere.
Phosphorus is often medium or high in fields that have received DAP for years.
If your card shows high P, you can safely reduce DAP for the next crop and save
money.
How to read zinc, iron, copper, manganese and boron
Micronutrients are rated as
deficient or sufficient against a critical limit. Below the limit, the crop is
likely to respond to that nutrient.
|
Micronutrient |
Commonly
used critical limit |
Extractant |
Common
deficiency sign |
|
Zinc (Zn) |
0.6 ppm |
DTPA |
Stunted plants, pale bands
on leaves, khaira in rice, poor tillering in wheat |
|
Iron (Fe) |
4.5 ppm |
DTPA |
Yellow young leaves with
green veins, common in alkaline and sandy soils |
|
Copper (Cu) |
0.2 ppm |
DTPA |
Twisted or dying leaf tips,
poor grain filling |
|
Manganese (Mn) |
2.0 ppm |
DTPA |
Grey or pinkish specks
between veins, seen in wheat on light soils |
|
Boron (B) |
0.5 ppm |
Hot water |
Poor flowering and pod set,
hollow or cracked stems |
Labs may use slightly different
limits, so rely on the rating printed on your own card. A study by ICAR
scientists published in Scientific Reports (2021) found that deficiency,
including latent (hidden) deficiency, was widespread in Indian soils: about 59%
for sulphur, 51% for zinc and 45% for boron.
If your card shows zinc
deficient, a basal dose of zinc
sulphate fertilizer at the rate on the card is the standard fix for wheat
and rice. For boron-deficient soils under mustard, chana or vegetables, a boron
fertilizer applied as soil dose or foliar spray as per the card's advice
supports flowering and seed set.
How to convert the card's advice into fertilizer bags
The card gives nutrient kg per
hectare; you buy products in bags per acre. Use this formula: product needed =
nutrient needed ÷ nutrient % in product × 100. Then divide by 2.47 to go from
hectare to acre.
Worked example: wheat, 120:60:40 kg NPK per hectare
1.
Phosphorus first: 60 kg P2O5 ÷ 46% (DAP) × 100 = about
130 kg DAP per hectare. This DAP also gives about 23 kg N.
2.
Nitrogen balance: 120 − 23 = 97 kg N still needed. 97 ÷
46% (urea) × 100 = about 210 kg urea per hectare.
3.
Potash: 40 kg K2O ÷ 60% (MOP) × 100 = about 67 kg MOP
per hectare.
4.
Convert to acre: divide each by 2.47. You get roughly
53 kg DAP, 85 kg urea and 27 kg MOP per acre.
5.
Split the urea as the card or local advice says,
usually part at sowing and the rest with the first and second irrigations.
If DAP is short, the same method
works with SSP (16% P2O5) or NPK complexes. Just remember to count the N and K
they supply before adding urea and MOP.
Common mistakes farmers make with the Soil Health Card
•
Using a card that is more than three years old or
belongs to a different plot.
•
Reading only the fertilizer table and skipping pH and
EC, then wondering why fertilizer did not work.
•
Applying the same dose to all fields even though one
field tests high in phosphorus.
•
Confusing kg of nutrient with kg of product, for
example applying 60 kg DAP when the card says 60 kg P2O5.
•
Ignoring micronutrient deficiencies until symptoms show
up mid-season, when they cost more to fix.
•
Not keeping cards year to year, which is the only way
to see if organic carbon and nutrient levels are improving.
What to do next
Download your card, check the
plot details and read pH, EC and organic carbon first. Then mark every nutrient
rated low or deficient and convert the card's advice into bags per acre before
you visit the dealer. If your card is older than three years, collect a fresh
sample this month.
Follow the product label and
local agriculture officer advice for exact doses. For FPOs and dealers planning
bulk stock of micronutrients and organic inputs from soil test data, Katyayani
Organics supplies across India.
Why trust this guide
Written by Team Katyayani, Editorial Team at Katyayani Organics. Cross-checked against published research and university extension programs.

Leave a Comment